
SplineSeries QML Type
Presents data as spline charts. 更多...
| Import Statement: | import QtCharts 2.2 |
| Instantiates: | QSplineSeries |
| 基类: |
属性
详细描述
A spline series stores the data points and the segment control points needed by QPainterPath to draw a spline. The control points are automatically calculated when the data changes. The algorithm computes the points so that the normal spline can be drawn.
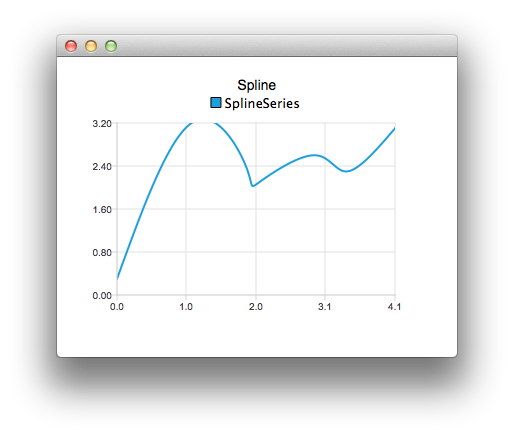
The following QML code shows how to create a simple spline chart:
  ChartView {
      title: "Spline"
      anchors.fill: parent
      antialiasing: true

      SplineSeries {
          name: "SplineSeries"
          XYPoint { x: 0; y: 0.0 }
          XYPoint { x: 1.1; y: 3.2 }
          XYPoint { x: 1.9; y: 2.4 }
          XYPoint { x: 2.1; y: 2.1 }
          XYPoint { x: 2.9; y: 2.6 }
          XYPoint { x: 3.4; y: 2.3 }
          XYPoint { x: 4.1; y: 3.1 }
      }
  }
属性
Controls the cap style of the line. Set to one of Qt.FlatCap, Qt.SquareCap or Qt.RoundCap. By default, the cap style is Qt.SquareCap.
参见 Qt::PenCapStyle.
Controls the style of the line. Set to one of Qt.NoPen, Qt.SolidLine, Qt.DashLine, Qt.DotLine, Qt.DashDotLine, or Qt.DashDotDotLine. Using Qt.CustomDashLine is not supported in the QML API. By default, the style is Qt.SolidLine.
参见 Qt::PenStyle.