
LineSeries QML Type
Presents data in line charts. 更多...
| Import Statement: | import QtCharts 2.2 |
| Instantiates: | QLineSeries |
| 基类: |
属性
详细描述
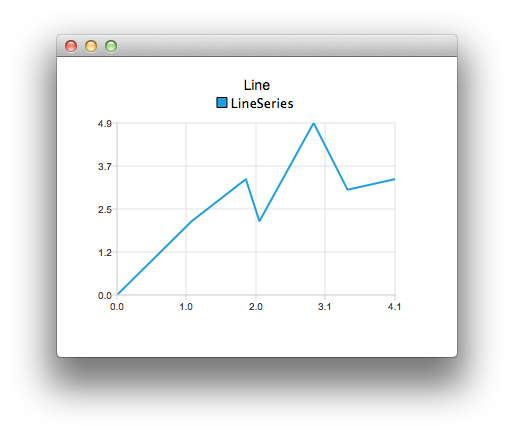
A line chart is used to show information as a series of data points connected by straight lines.
The following QML example shows how to create a simple line chart:
  ChartView {
      title: "Line"
      anchors.fill: parent
      antialiasing: true

      LineSeries {
          name: "LineSeries"
          XYPoint { x: 0; y: 0 }
          XYPoint { x: 1.1; y: 2.1 }
          XYPoint { x: 1.9; y: 3.3 }
          XYPoint { x: 2.1; y: 2.1 }
          XYPoint { x: 2.9; y: 4.9 }
          XYPoint { x: 3.4; y: 3.0 }
          XYPoint { x: 4.1; y: 3.3 }
      }
  }
属性
Controls the cap style of the line. Set to one of Qt.FlatCap, Qt.SquareCap or Qt.RoundCap. By default the cap style is Qt.SquareCap.
参见 Qt::PenCapStyle.
Controls the style of the line. Set to one of Qt.NoPen, Qt.SolidLine, Qt.DashLine, Qt.DotLine, Qt.DashDotLine, or Qt.DashDotDotLine. Using Qt.CustomDashLine is not supported in the QML API. By default, the style is Qt.SolidLine.
参见 Qt::PenStyle.